Workforce by occupation type
On this page
Occupation type
In considering the composition of Queensland’s public sector, the number of FTE in key frontline, frontline and frontline support, and corporate roles is also relevant.
The ABS Australian and New Zealand Standard Classification of Occupations (ANZSCO) is an industry standard coding system that provides a uniform way for all organisations to categorise different types of roles.
Every Queensland public sector position is allocated a specific ANZSCO code when it is created. Each role is also categorised as either frontline and frontline support, or as a corporate role. In our data we also differentiate key frontline roles.
Key frontline, frontline and frontline support roles deliver services, programs and outcomes directly to the community, or provide essential support enabling the development and delivery of frontline services, programs and outcomes.
Key frontline roles are those that are critical or essential in a community and include ambulance officers, nurses, doctors, teachers, police, firefighters, child safety case workers, youth case workers and correctional officers.
Frontline and frontline support roles provide essential support enabling the development and delivery of frontline services, the development and delivery of government policy and programs as well as outcomes for the community.
Corporate roles provide organisation-wide support to enable agencies to deliver the Queensland Government’s objectives for the community and frontline services. These roles include employees working in human resource management, accounts and finance, information technology and communications.
Nine out of ten Queensland public servants work in either key frontline or frontline and frontline
support roles.
Between March 2021 and March 2025:
- The number of key frontline FTE increased by 17,723.64.
- The number of frontline and frontline support FTE increased by 12,802.48.
- The number of corporate FTE increased by 4,909.87.
| FTE Numbers | Mar 2021 | Mar 2022 | Mar 2023 | Mar 2024 | Mar 2025 |
|---|---|---|---|---|---|
| Key frontline roles | 148,246.48 | 152,544.72 | 154,138.53 | 159,550.51 | 165,970.12 |
| Frontline and frontline support | 67,200.36 | 68,886.12 | 70,139.84 | 74,382.77 | 80,002.84 |
| Corporate | 20,000.88 | 20,338.03 | 22,031.12 | 24,078.85 | 24,910.75 |
Source: MOHRI 2021–2025.
As a proportion of the total workforce, between March 2021 and March 2025:
- Key frontline roles have decreased from 62.96% of the total to 61.27%.
- Frontline and frontline support roles have increased from 28.54% to 29.53%.
- Corporate FTE have increased from 8.49% to 9.20%.
| Occupation type FTE in past 12 months | March 2024 | March 2025 | Variance | % variance |
|---|---|---|---|---|
| Key frontline roles | 159,550.51 | 165,970.12 | 6,419.61 | 4.02% |
| Frontline and frontline support | 74,382.77 | 80,002.84 | 5,620.07 | 7.56% |
| Corporate | 24,078.85 | 24,910.75 | 831.90 | 3.45% |
Source: MOHRI March 2024 and March 2025.
Key frontline roles
There are 165,970.12 key frontline FTE in the Queensland public sector.
| Key frontline FTE | Mar 2025 |
|---|---|
| Disability support workers | 919.87 |
| Youth and case workers | 1,177.9 |
| Child safety case workers | 1,953.27 |
| TAFE teachers and tutors | 2,095.61 |
| Firefighters | 2,977.68 |
| Correction officers | 5,273.01 |
| Ambulance officers | 5,503.24 |
| Teacher aides | 10,955.65 |
| Police | 12,278.72 |
| Doctors | 13,124.17 |
| Health practitioners/professional/technical | 17,251.27 |
| Nurses and midwives | 43,866.99 |
| Teachers | 48,592.74 |
| Total | 165,970.12 |
The number of key frontline FTE roles has increased steadily over the past five years and particularly in the past two years:
- Correctional officers have increased by 13.88% (642.87 FTE) over the past year in response to increased prisoner numbers and the 2025 opening of the Lockyer Valley Correctional Centre.
- Numbers of sworn police officers increased by 3.26% (388.03 FTE) over the past year as a result of a significant recruitment drive.
- The continuous cycle of forward recruitment activities conducted by the Queensland Ambulance Service increased the number of ambulance officers by 5.19% (271.36 FTE) over the past year.
- Ongoing local and international recruitment in Queensland Health as well as expansion of facilities to meet the needs of the community has meant that the number of nurses, midwives, doctors and other health practitioners each increased by over 6% (4,611.11 total FTE) over the past year.
- Youth and case workers increased by 13.66% (141.56 FTE) over the past year.
The continuing decrease in disability support workers -2.16% (-46.25 FTE) reflects a decline in National Disability Insurance Scheme (NDIS) participant numbers supported by the Department of Families, Seniors, Disability Services and Child Safety including the cessation of NDIS respite services.
Key frontline year-on-year variation: | Mar 2021 | Mar 2022 | Mar 2023 | Mar 2024 | Mar 2025 |
|---|---|---|---|---|---|
| Correction officers | 27.16% | 13.95% | 1.14% | 6.52% | 13.88% |
| TAFE teachers and tutors | 1.73% | 3.26% | 2.62% | 5.88% | -2.16% |
| Disability support workers | -3.88% | -9.50% | -4.51% | -0.23% | -2.47% |
| Teachers | 0.71% | 0.26% | 0.33% | 0.94% | 0.23% |
| Child safety case workers | 0.29% | 5.79% | 1.10% | 5.20% | 0.68% |
| Teacher aides | -0.23% | -0.49% | 0.88% | 0.15% | 1.39% |
| Police | 1.06% | 0.04% | -0.49% | -0.14% | 3.26% |
| Ambulance officers | 2.26% | 5.36% | 2.90% | 5.64% | 5.19% |
| Firefighters | 2.80% | 1.24% | 3.10% | 4.74% | 5.72% |
| Nurses and midwives | 3.03% | 6.14% | 1.53% | 5.69% | 6.04% |
| Health practitioners /professional / technical | 21.69% | 5.54% | 1.33% | 6.59% | 6.78% |
| Doctors | 3.77% | 2.45% | 2.73% | 6.77% | 8.42% |
| Youth and case workers | 4.93% | 9.01% | 1.63% | 6.82% | 13.66% |
| Total | 3.81% | 2.09% | 1.04% | 3.51% | 4.02% |
Source: MOHRI 2021–2025.
The number of teachers has steadily increased over the five years to 2025, while the number of teacher aides has grown notably following declines in 2021 and 2022.
That said, the current Queensland Government acknowledges the challenges associated with recruiting teachers and so has committed to the More Teachers, Better Education election commitment. The election commitment involves the delivery of 550 more school-based teachers and teacher aides over four years (March 2024 to March 2028).
At the first annual milestone (March 2025), 259.85 additional full-time equivalent (FTE) teachers and teacher-aides have been employed, delivering 47% of the total commitment in the first year. This includes an additional 109.58 teacher FTE and 150.27 teacher-aide FTE, with stable student enrolment growth.
The number of educators in Queensland TAFE colleges has decreased over the past year, following notable growth in 2024. Movement in FTE at TAFE Queensland is largely driven by demand for qualifications and skill sets in skill shortage areas that lead to employment outcomes or further study pathways. The workforce is strategically designed to expand and contract to meet demand.
Frontline and frontline support
Frontline and frontline support roles deliver services directly to the community or work in functions that are essential to the delivery of services directly to the community.
Examples of frontline and frontline support roles are:
- builders, electricians and other construction industry tradespersons
- clerical and administrative support employees in police, fire or ambulance stations and other centres accessible by the community for government services
- earth science, environmental and agricultural scientist/officers, laboratory technicians, marine biologists and geologists
- front counter and customer enquiry employees, call centre and online customer service employees in Queensland Government service centres
- grants management officers
- hospital and health service employees (non-corporate roles)
- mine inspectors, park rangers, fisheries officers, road engineers, surveyors, regulatory inspectors and quarantine officers
- prison and community corrections employees
- program or project planners, administrators, managers and strategy employees who formulate public policies for the provision of government services, programs and outcomes affecting communities (e.g. fisheries, forestry, waste management, public health, youth programs, tourism, environment, planning services and systems, economic strategy and industry development)
- public prosecutors, bailiffs, clerks of court and court registry officers
- radio dispatchers
- recreation facilitators and instructors
- school crossing supervisors, art gallery and museum curators and guides, archivists and librarians
- school employees
- social workers.
The number of frontline and frontline support FTE has increased:
- by 7.56% over the 12 months between March 2024 and March 2025
- from 67,200.36 to 80,002.84 FTE over the five years to 2025.
The largest percentage increases over the past 12 months have been in the role of program or project administrator, which increased by 14% (664.86 FTE) and policy analyst, which increased by 9.45% (117.53 FTE).
As per the ANZSCO code, a program or project administrator is defined as being involved in planning, organising and overseeing the administration of programs, special projects and support services within an organisation. They are responsible for advising senior management, implementing decisions and overseeing contractors. Additionally, they prepare reports, collect data and analyse
project outcomes.
A policy analyst develops and analyses policies that guide the design, implementation and modification of government operations and programs. They also collect and analyse data to create intelligence.
| Frontline/frontline support FTE | Mar 2025 |
|---|---|
| Clerical and office support workers (nec) | 1,068.72 |
| Waiter | 1,176.48 |
| Security officer | 1,190.07 |
| Gardener (general) | 1,221.91 |
| Information officer | 1,238.11 |
| Policy analyst | 1,360.64 |
| Specialist managers (nec) | 1,401.15 |
| Policy and planning manager | 1,764.70 |
| Office manager | 2,491.16 |
| Labourers (nec) | 3,817.15 |
| Commercial cleaner | 4,760.87 |
| Program or project administrator | 5,414.81 |
| General clerk | 15,965.93 |
| Role category with less than 1000 FTE in role category | 37,131.14 |
| Total | 80,002.84 |
nec – not elsewhere classified
| Frontline/frontline support year-on-year variation: 2021–2025 (2) | Mar 2021 | Mar 2022 | Mar 2023 | Mar 2024 | Mar 2025 |
|---|---|---|---|---|---|
| Commercial cleaner | 10.01% | -0.59% | -5.49% | 2.56% | 0.64% |
| Office manager | -2.89% | 1.14% | 3.31% | 5.33% | 0.97% |
| Information officer | -4.52% | -7.49% | 5.34% | -7.16% | 1.22% |
| Gardener (general) | -3.61% | 0.78% | -0.28% | 1.34% | 1.63% |
| Waiter | -1.67% | -0.54% | 5.93% | 1.12% | 5.57% |
| Specialist managers (nec) | N/A | 9.26% | 5.58% | ||
| Labourers (nec) | -2.62% | 11.27% | 2.44% | 3.21% | 5.59% |
| Clerical and office support workers (nec) | N/A | 6.26% | |||
| General clerk | -2.53% | 4.96% | -0.77% | 3.59% | 6.68% |
| Policy and planning manager | 6.96% | 3.37% | 24.88% | 11.36% | 6.85% |
| Security officer | N/A | 0.25% | 8.64% | 8.76% | |
| Policy analyst | -13.76% | 0.11% | 11.12% | 7.42% | 9.45% |
| Program or project administrator | -1.41% | 3.89% | 12.79% | 8.85% | 14.00% |
| Role category with less than 1000 FTE in role category | -6.47% | -1.30% | -2.33% | 4.90% | 9.24% |
| Total | -3.80% | 2.51% | 1.82% | 6.05% | 7.56% |
Source: MOHRI 2021–2025.
Corporate roles
Nine out of ten public servants are in either key frontline, frontline or frontline support roles. Corporate functions provide critical support to the frontline and enable frontline employees to do the critical work of delivering services to the community.
The recruitment of corporate functions was constrained during and immediately following the pandemic. When recruitment constraints were lifted, corporate FTE numbers increased as agencies sought to replenish their corporate workforce and provide greater support to the key frontline, frontline and frontline support workforce.
Between March 2022 and March 2023 corporate growth was 8.32%, and 9.29% between March 2023 and March 2024.
The growth in corporate services slowed to 3.45% between March 2024 and March 2025, and is now similar to pre-pandemic levels. In the 12 months between March 2018 and 2019 corporate services growth was 3.36%.
Notably, audit services roles reduced between March 2024 and March 2025—a decrease of 57.29% FTE. This is largely due to the removal of the Queensland Audit Office (QAO) from the MOHRI data collection reflecting the independence of that Office.
The removal of the QAO from the MOHRI collection has inflated the decrease in corporate services. However, the growth of corporate services has still slowed, even with the exclusion of the QAO. Excluding the QAO from the data set, over time, growth in corporate services between March 2024 and March 2025 had slowed to 4.31%.
| Corporate service roles FTE | Mar 2025 |
|---|---|
| Audit services | 132.77 |
| Legal services | 410.60 |
| Corporate services management | 644.86 |
| Information management | 1,008.06 |
| Communication, media and marketing | 1,260.69 |
| Executive services and support | 1,366.16 |
| Procurement and contract management | 1,391.63 |
| Governance and strategy | 1,566.56 |
| Property and facilities | 1,800.02 |
| Accounting and finance | 3,342.42 |
| Human resources | 5,166.78 |
| Information and communications technology | 6,820.20 |
| Total | 24,910.75 |
Corporate year-on-year variation: 2021–2025 | Mar 2021 | Mar 2022 | Mar 2023 | Mar 2024 | Mar 2025 |
|---|---|---|---|---|---|
| Audit services | -3.75% | -0.90% | 3.10% | 2.46% | -57.29% |
| Corporate services management | -1.49% | 62.16% | 29.11% | 53.14% | -6.07% |
| Legal services | -3.90% | -2.34% | 9.18% | 3.12% | -4.60% |
| Executive services and support | 2.09% | -0.22% | 26.82% | 9.16% | -3.49% |
| Accounting and finance | 1.03% | -1.64% | 4.56% | 4.39% | -1.51% |
| Information management | 0.64% | 1.62% | 8.76% | 8.47% | -1.41% |
| Communication, media and marketing | -2.20% | 0.64% | 11.52% | 5.04% | 0.84% |
| Human resources | -0.34% | 4.04% | 0.19% | 10.25% | 6.00% |
| Information and communications technology | 1.94% | -1.72% | 17.61% | 10.29% | 7.70% |
| Procurement and contract management | 3.21% | 0.02% | -6.07% | 0.66% | 8.05% |
| Governance and strategy | 3.15% | 6.48% | 19.82% | 13.02% | 8.86% |
| Property and facilities | -3.06% | 6.87% | -4.12% | 11.57% | 10.06% |
| Total | 0.56% | 1.69% | 8.32% | 9.29% | 3.45% |
Source: MOHRI 2021–2025.
Case study: Diversity of public sector roles
The public sector is made up of many different roles and functions. While the community sees and directly experiences the work of many public servants, there are many public servants that we don’t necessarily know about, working each day to make a difference.
Unlicensed electrical work can lead to unsafe and non-compliant installations, significantly increasing the risk of injuries, fatalities and property damage caused by unsafe electrical practices.
Investigations conducted into unlicensed persons performing electrical work have resulted in the detection of many unsafe electrical installations due to untrained or inadequately skilled tradespeople.
The increasing use of online platforms to source services has increased the ease of advertising but also increased the challenge.
The Electrical Safety Office’s Compliance Unit (ESOCU) has responsibility for unlicensed electrical contracting, unlicensed electrical work, non-compliant advertising and taking appropriate enforcement action. With Department partners, the unit has been successful in obtaining three court ordered injunctions for repeat offenders who failed to comply with directions.
The ESOCU's implementation of the Managing Identified and Potential Electrical Safety Risks in Domestic Properties procedure has helped reduce potential risks by notifying homeowners of suspected unlicensed or unsafe electrical work. To date 1,791 notifications have been sent to homeowners and occupiers.
The ESOCU has:
- achieved nine successful prosecutions for unlicensed electrical work within the Queensland court system, resulting in $395,000 in fines issued by the courts
- successfully obtained and executed two search warrants against repeat unlicensed operators
- reviewed 5,217 online profiles for compliance
- completed 352 assessments
- issued 231 notices
- facilitated the removal of 1,048 non-compliant advertisements, significantly reducing the amount of unlicensed electrical services online.
Location
An analysis of the 2021 Census by the Queensland Government Statistician’s Office shows that one in five usual residents of Australia live in Queensland(3). Forty-nine percent of the Queensland population live in Brisbane.
From 2021–2024, the population growth of Queensland saw the Greater Brisbane area increase by 213,300 people (8.3%), while the rest of the state increased by 158,500 people (6.0%).
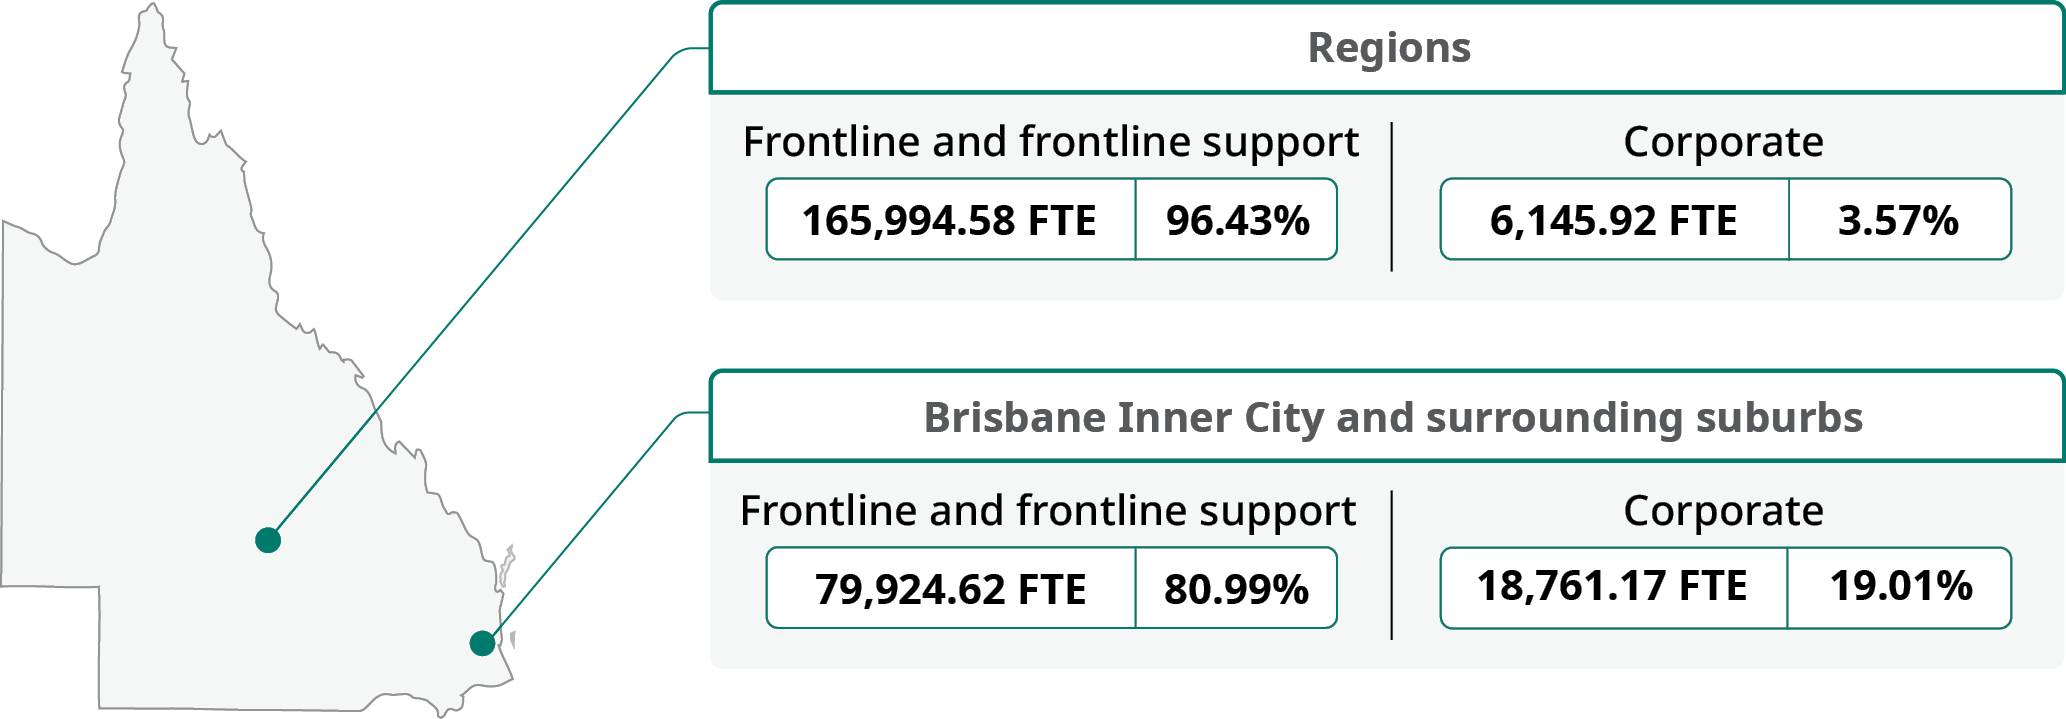
The number of FTE based in both Brisbane Inner City and surrounding suburbs(4) as well as regional locations across the state, has steadily increased in the past five years.
FTE numbers across the state have increased notably between 2024 and 2025. While this upward trend is the case for total FTE, it is also the trend for both corporate roles and frontline (including key frontline) and frontline support roles.
Close to 20.91% of FTE are located in the Brisbane Inner City statistical area, with 15.53% of FTE working in Brisbane North, East, South, West. There are 63.56% FTE working in the regions.
Source: MOHRI March 2025.
Regionally based FTE as % of total sector workforce
Outside of the Brisbane Inner City statistical area, sector workers are concentrated in several key regional centres.

Source: MOHRI March 2025.
| Key frontline, frontline and frontline support | Corporate roles | Total | % of total public sector workforce | |||
|---|---|---|---|---|---|---|
| FTE | Proportion frontline FTE % | FTE | Proportion corporate FTE % | |||
| Brisbane – East | 6,026.62 | 99.14% | 52.43 | 0.86% | 6,079.05 | 2.24% |
| Brisbane – North | 10,263.62 | 92.44% | 839.15 | 7.56% | 11,102.77 | 4.10% |
| Brisbane – South | 19,793.31 | 94.23% | 1,212.25 | 5.77% | 21,005.56 | 7.76% |
| Brisbane – West | 3,815.10 | 98.80% | 46.50 | 1.20% | 3,861.60 | 1.43% |
| Brisbane Inner City | 40,025.97 | 70.67% | 16,610.84 | 29.33% | 56,636.81 | 20.91% |
| Cairns | 15,107.21 | 95.43% | 723.89 | 4.57% | 15,831.10 | 5.85% |
| Central Queensland | 10,824.26 | 95.59% | 499.67 | 4.41% | 11,323.93 | 4.18% |
| Darling Downs - Maranoa | 5,115.26 | 97.93% | 108.08 | 2.07% | 5,223.34 | 1.93% |
| Gold Coast | 22,553.74 | 96.16% | 901.36 | 3.84% | 23,455.10 | 8.66% |
| Ipswich | 20,225.46 | 97.40% | 539.54 | 2.60% | 20,765.00 | 7.67% |
| Logan - Beaudesert | 13,040.01 | 97.69% | 308.00 | 2.31% | 13,348.01 | 4.93% |
| Mackay - Isaac - Whitsunday | 7,224.13 | 96.45% | 265.59 | 3.55% | 7,489.72 | 2.77% |
| Moreton Bay - North | 11,093.94 | 98.28% | 194.07 | 1.72% | 11,288.01 | 4.17% |
| Moreton Bay - South | 4,035.02 | 99.13% | 35.56 | 0.87% | 4,070.58 | 1.50% |
| Queensland - Outback | 6,382.54 | 96.84% | 208.03 | 3.16% | 6,590.57 | 2.43% |
| Sunshine Coast | 15,059.32 | 95.69% | 677.47 | 4.31% | 15,736.79 | 5.81% |
| Toowoomba | 8,672.81 | 94.27% | 527.39 | 5.73% | 9,200.20 | 3.40% |
| Townsville | 13,929.22 | 94.88% | 751.00 | 5.12% | 14,680.22 | 5.42% |
| Wide Bay | 12,731.66 | 96.91% | 406.27 | 3.09% | 13,137.93 | 4.85% |
Source: MOHRI March 2025.
Case study: Connecting across Queensland
The establishment of the Regional Collaborative Governance Model (the Model) provides a structure to support place-based regional planning and coordination of work across agencies. The model includes six Regional Leadership Networks providing coverage of Queensland regional areas:
- Far North Queensland
- North and North West Queensland
- Mackay Isaac Whitsunday
- Central Queensland
- Wide Bay Burnett
- Darling Downs South West.
In total, there are 205 senior government officers from across 20 agencies that participate in Regional Leadership Networks.
The Model is led and delivered by the Department of Natural Resources and Mines, Manufacturing and Regional and Rural Development with support from the Public Sector Commission.
The Model is supporting government to understand the priorities, challenges and opportunities experienced in Queensland’s regions and provides a mechanism to elevate and address these matters through cross-agency collaboration.
Appointment type
Close to 83% of the Queensland public sector are employed on a permanent basis. This data has been very stable over the past five years.
Appointment type FTE: March 2025
| Corporate service roles FTE | FTE |
|---|---|
| Permanent | 224,548.37 |
| Temporary | 37,346.05 |
| Contract | 2,127.68 |
| Casual | 6,861.61 |
| Total | 270,883.71 |
Source: MOHRI March 2025.
Employment status
Whole-of-sector figures on employment status have been stable over the past five years with 61.35% employed full-time, 32.37% and 6.28% employed on a part-time and casual basis respectively.
Employment status headcount: March 2025
| Employment status | Headcount: Mar 2025 |
|---|---|
| Full-Time | 197,906 |
| Part-Time | 104,439 |
| Casual | 20,255 |
| Total | 322,600 |
Source: MOHRI March 2025.